Surveys of Consumers Website Redesign
What started as a visual refresh turned into an information architecture rebuild after research showed the real problem was findability, not familiarity.
Situation
A federally funded data platform that journalists, researchers, and policymakers depend on was losing users to poor information architecture
The University of Michigan Surveys of Consumers produces the Index of Consumer Sentiment—one of the most cited economic indicators in the U.S. When this number moves, markets react, the Fed takes notice, and newsrooms worldwide report it.
But the platform delivering this data was fractured: two separate websites, no search, ambiguous navigation labels, and the ICS itself buried in paragraphs of text. Economists and policymakers who depend on this data for real decisions were resorting to trial-and-error or giving up entirely. Our team was brought in for a year-long engagement to diagnose the root causes and redesign the experience.
Task
What I owned as team lead
- Own the research strategy. Define what to measure, which methods to use, and what counted as valid evidence before moving into design.
- Lead problem reframing. Shift the project from a visual-refresh brief to an information-architecture redesign grounded in user evidence.
- Drive stakeholder alignment. Translate research and statistical findings into decisions the client and team could align around.
- Set priorities and scope. Focus the team on the highest-leverage changes and deprioritize lower-impact ideas such as tutorial flows.
01 // Defining the Problem
One in ten users couldn't find their data — on a platform built for data
A live site survey (N=347) revealed the core problem: the site was organized for its producers, not its users. The IA mirrored how the SoC team stored data internally — not how an economist, journalist, or student would try to find it.
(out of 5—for a data platform)
- Dual-site confusion: headline data and tables lived on two separate URLs. 43% of test participants questioned the split.
- No search: hundreds of tables and charts, no keyword search.
- Buried headline values: the ICS — the site's most important number — was hidden inside body copy.
- Ambiguous labels: "Papers" vs "Reports" left users guessing.
02 // Research Strategy
Quantitative baseline first, then qualitative depth
I insisted on a quantitative baseline before anyone opened Figma. Without numbers, "the nav is confusing" is just an opinion. We first used survey data, usability testing, and email archive analysis to diagnose the problem, then used a structured A/B-style usability comparison to validate whether the redesign improved task performance.
Round 1 — Understanding the problem (Fall 2025)
- Live site survey (N=347) on the original SoC websites.
- A group: 10 target users completed task-based usability testing on the original live site.
- Content analysis of the SoC support email archive.
Round 2 — Evaluating the redesign (Winter 2026)
- B group: 10 target users completed the same 3 core tasks on the redesign prototype.
- Both groups were evaluated with the same task rubric for structured comparison.
- 3 core tasks: find ICS headline value, find demographic breakdowns, find release dates.
03 // Who We Were Designing For
Two archetypes at opposite ends of the spectrum
To synthesize raw findings from the usability sessions, survey open-responses, and email analysis, I led the team through affinity mapping. Grouping user quotes by theme surfaced the recurring pain points and the two distinct user types underneath them.
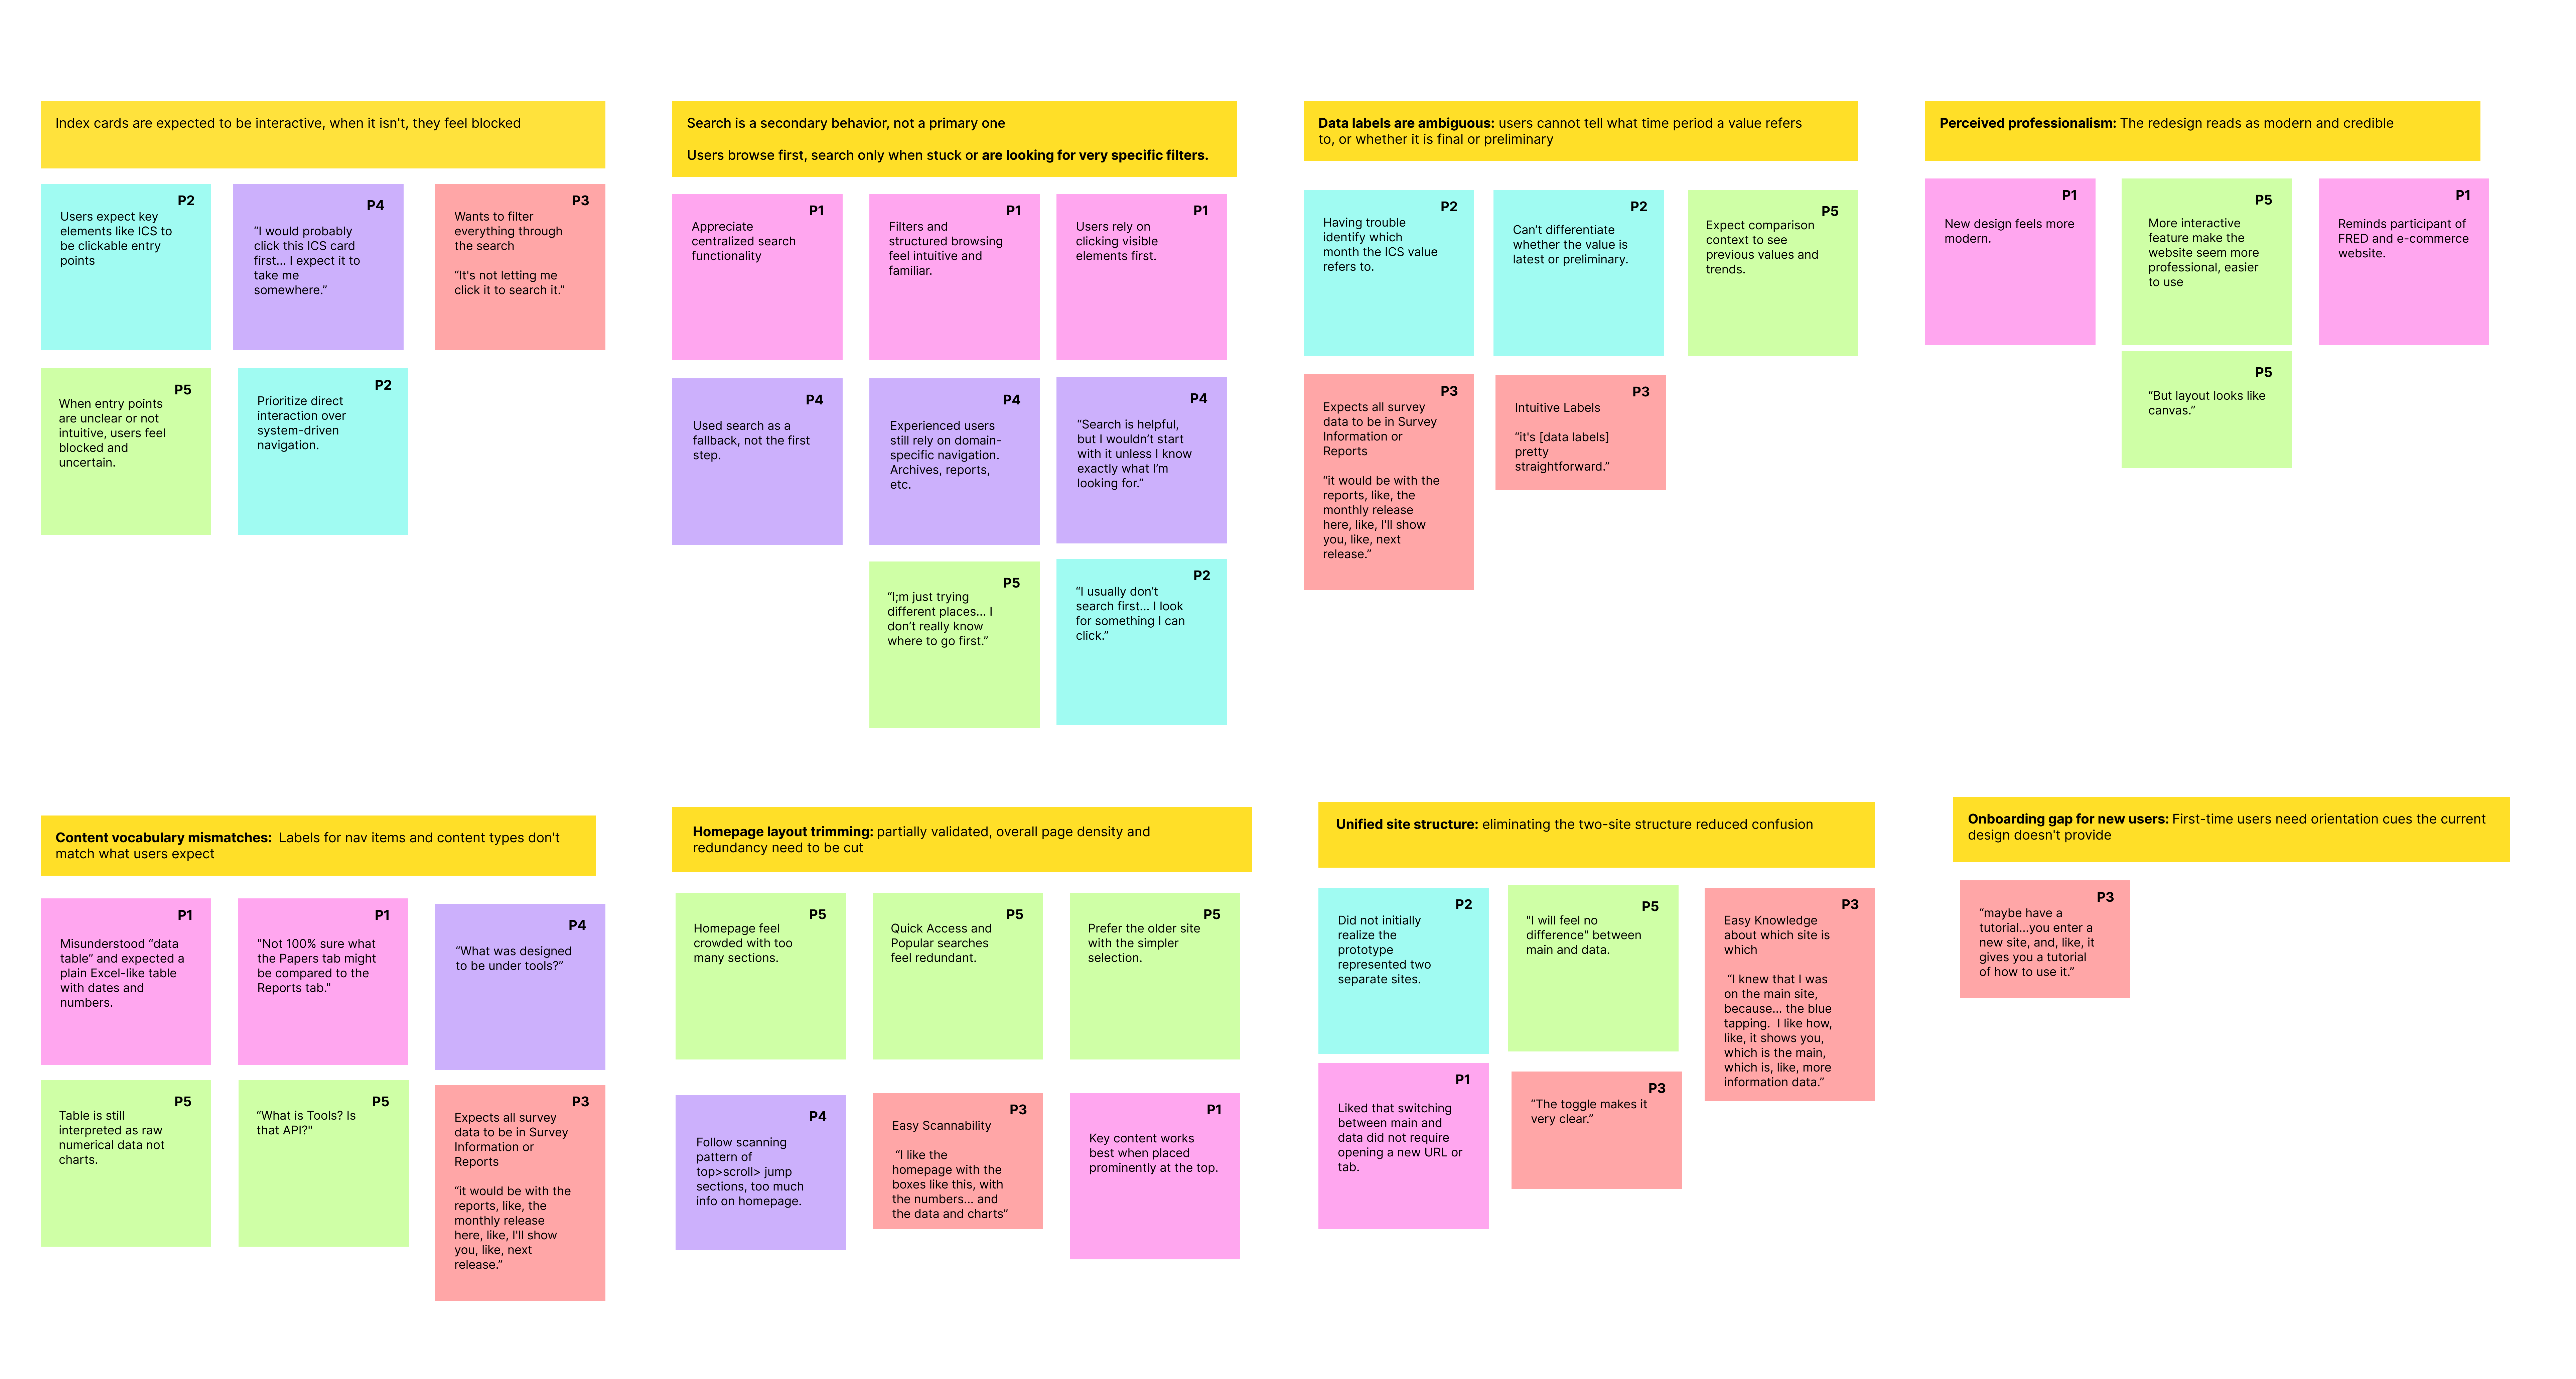
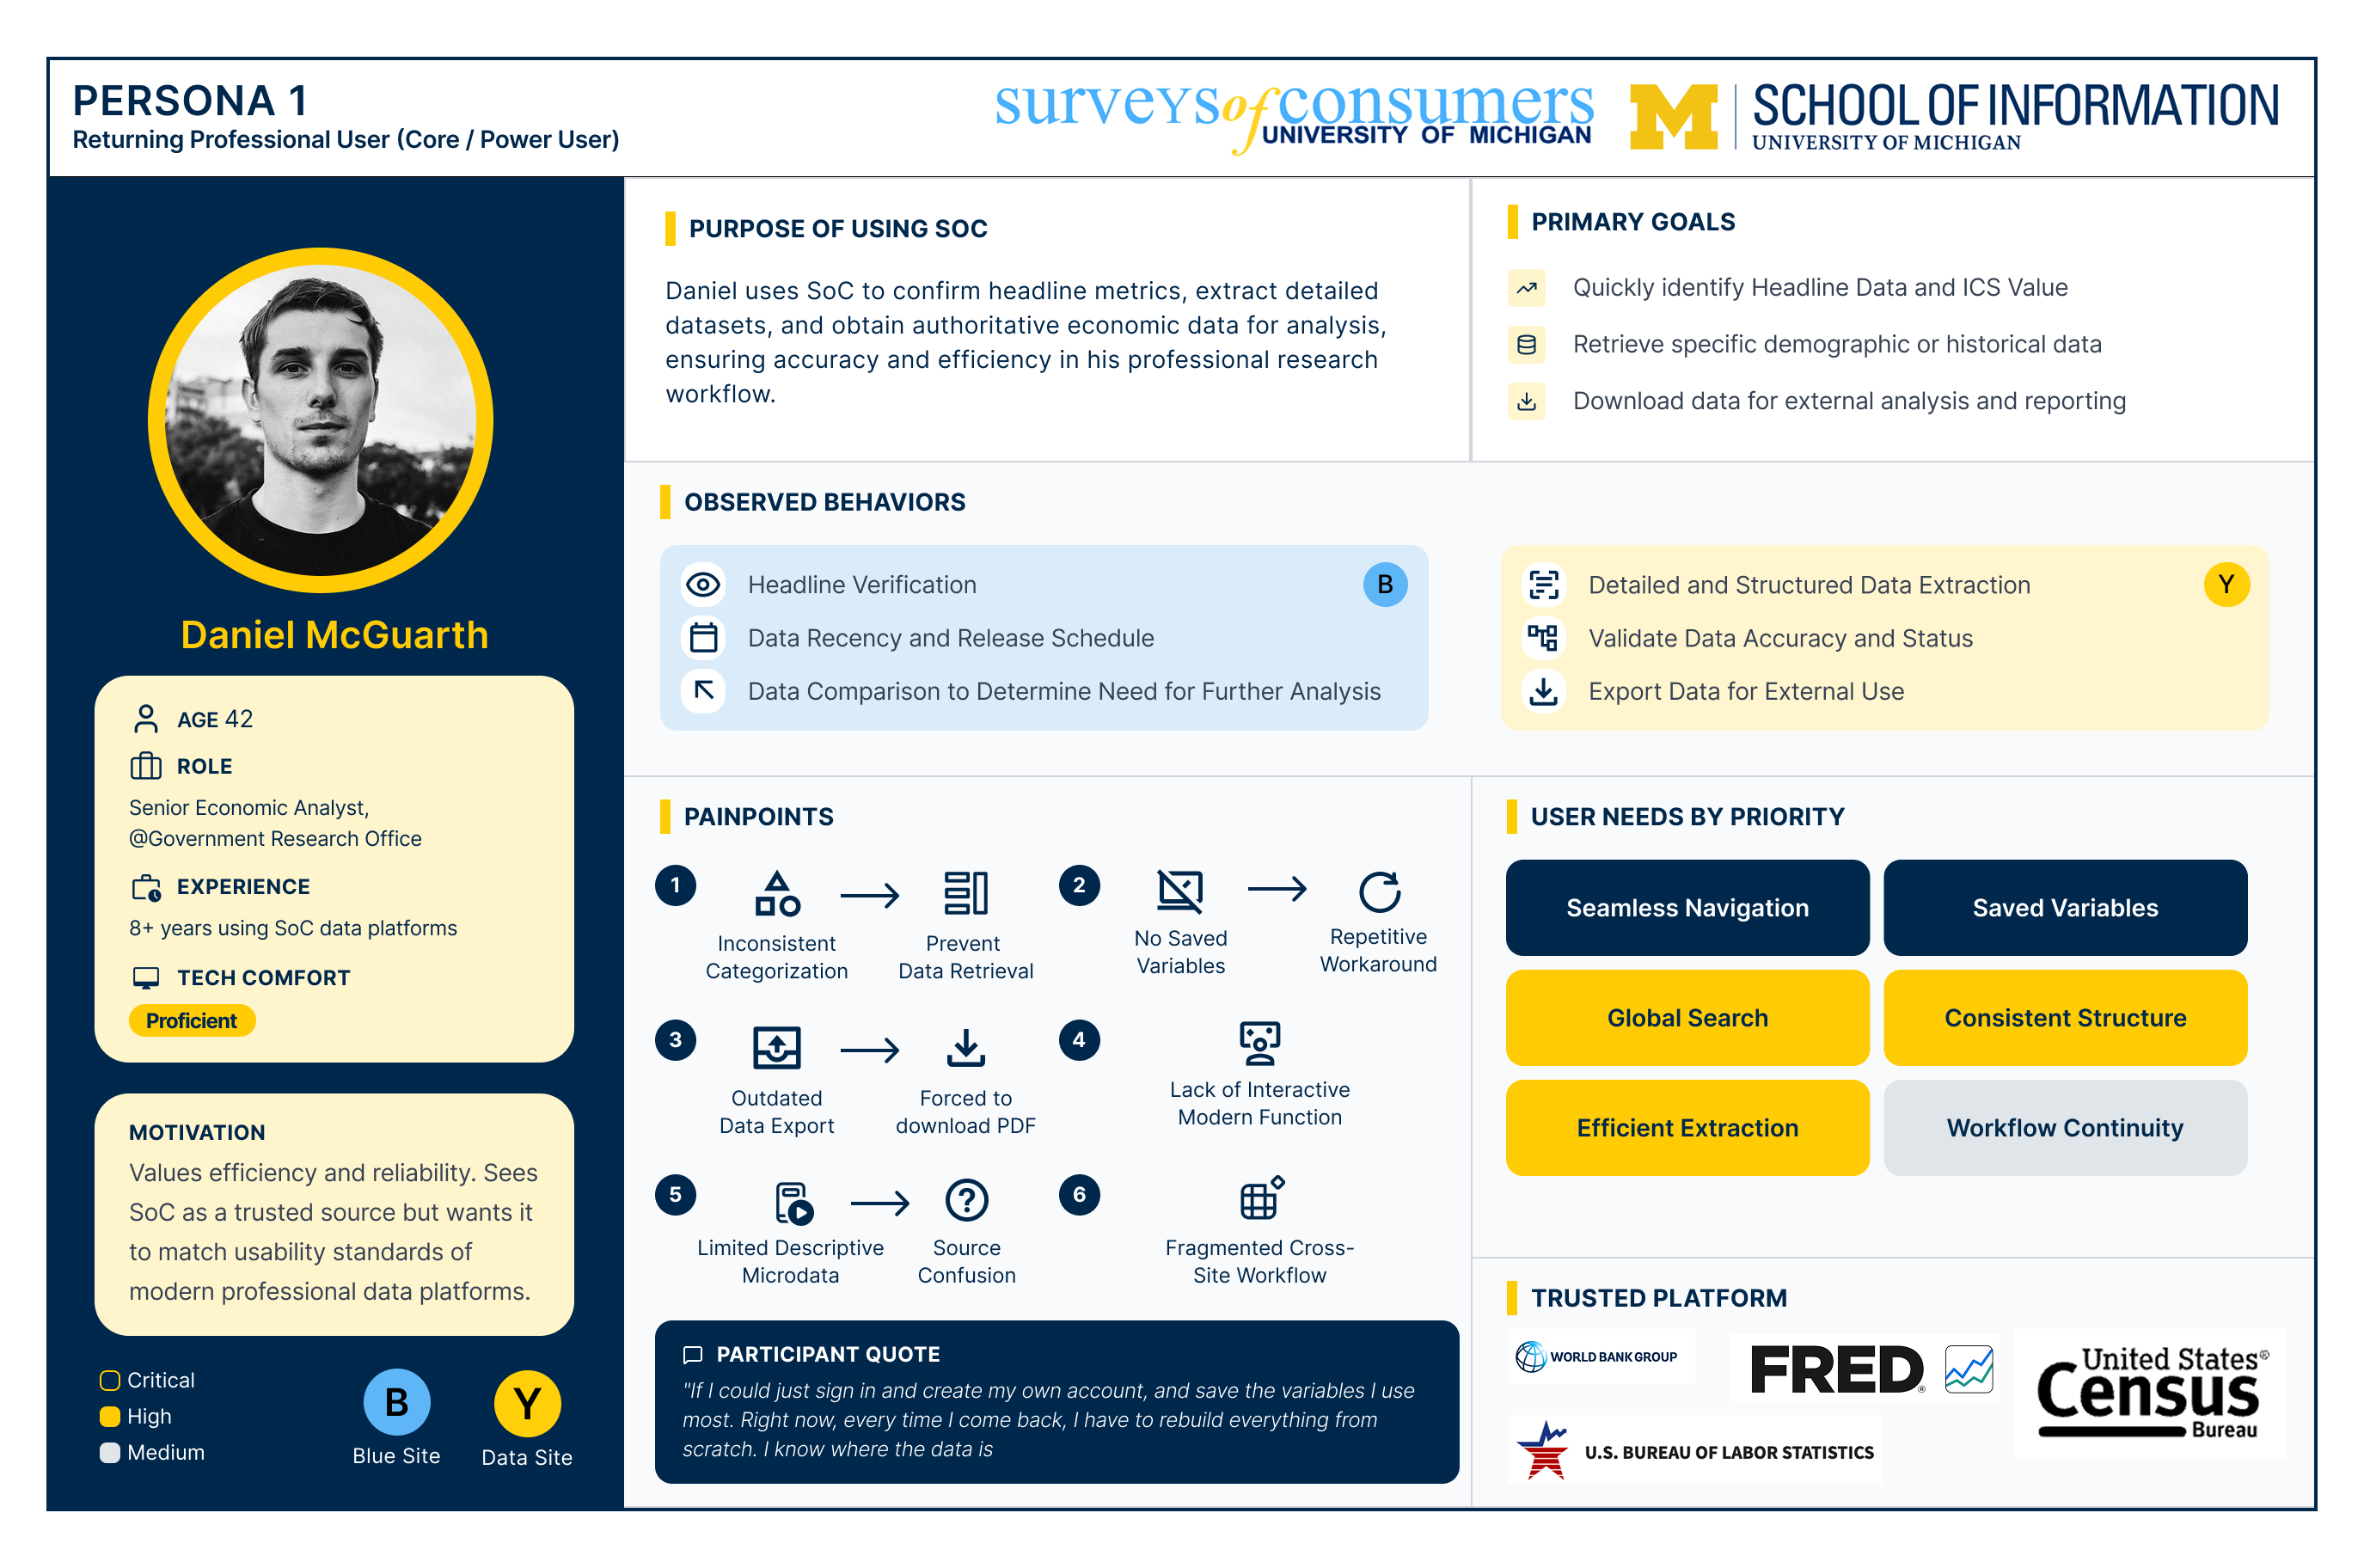
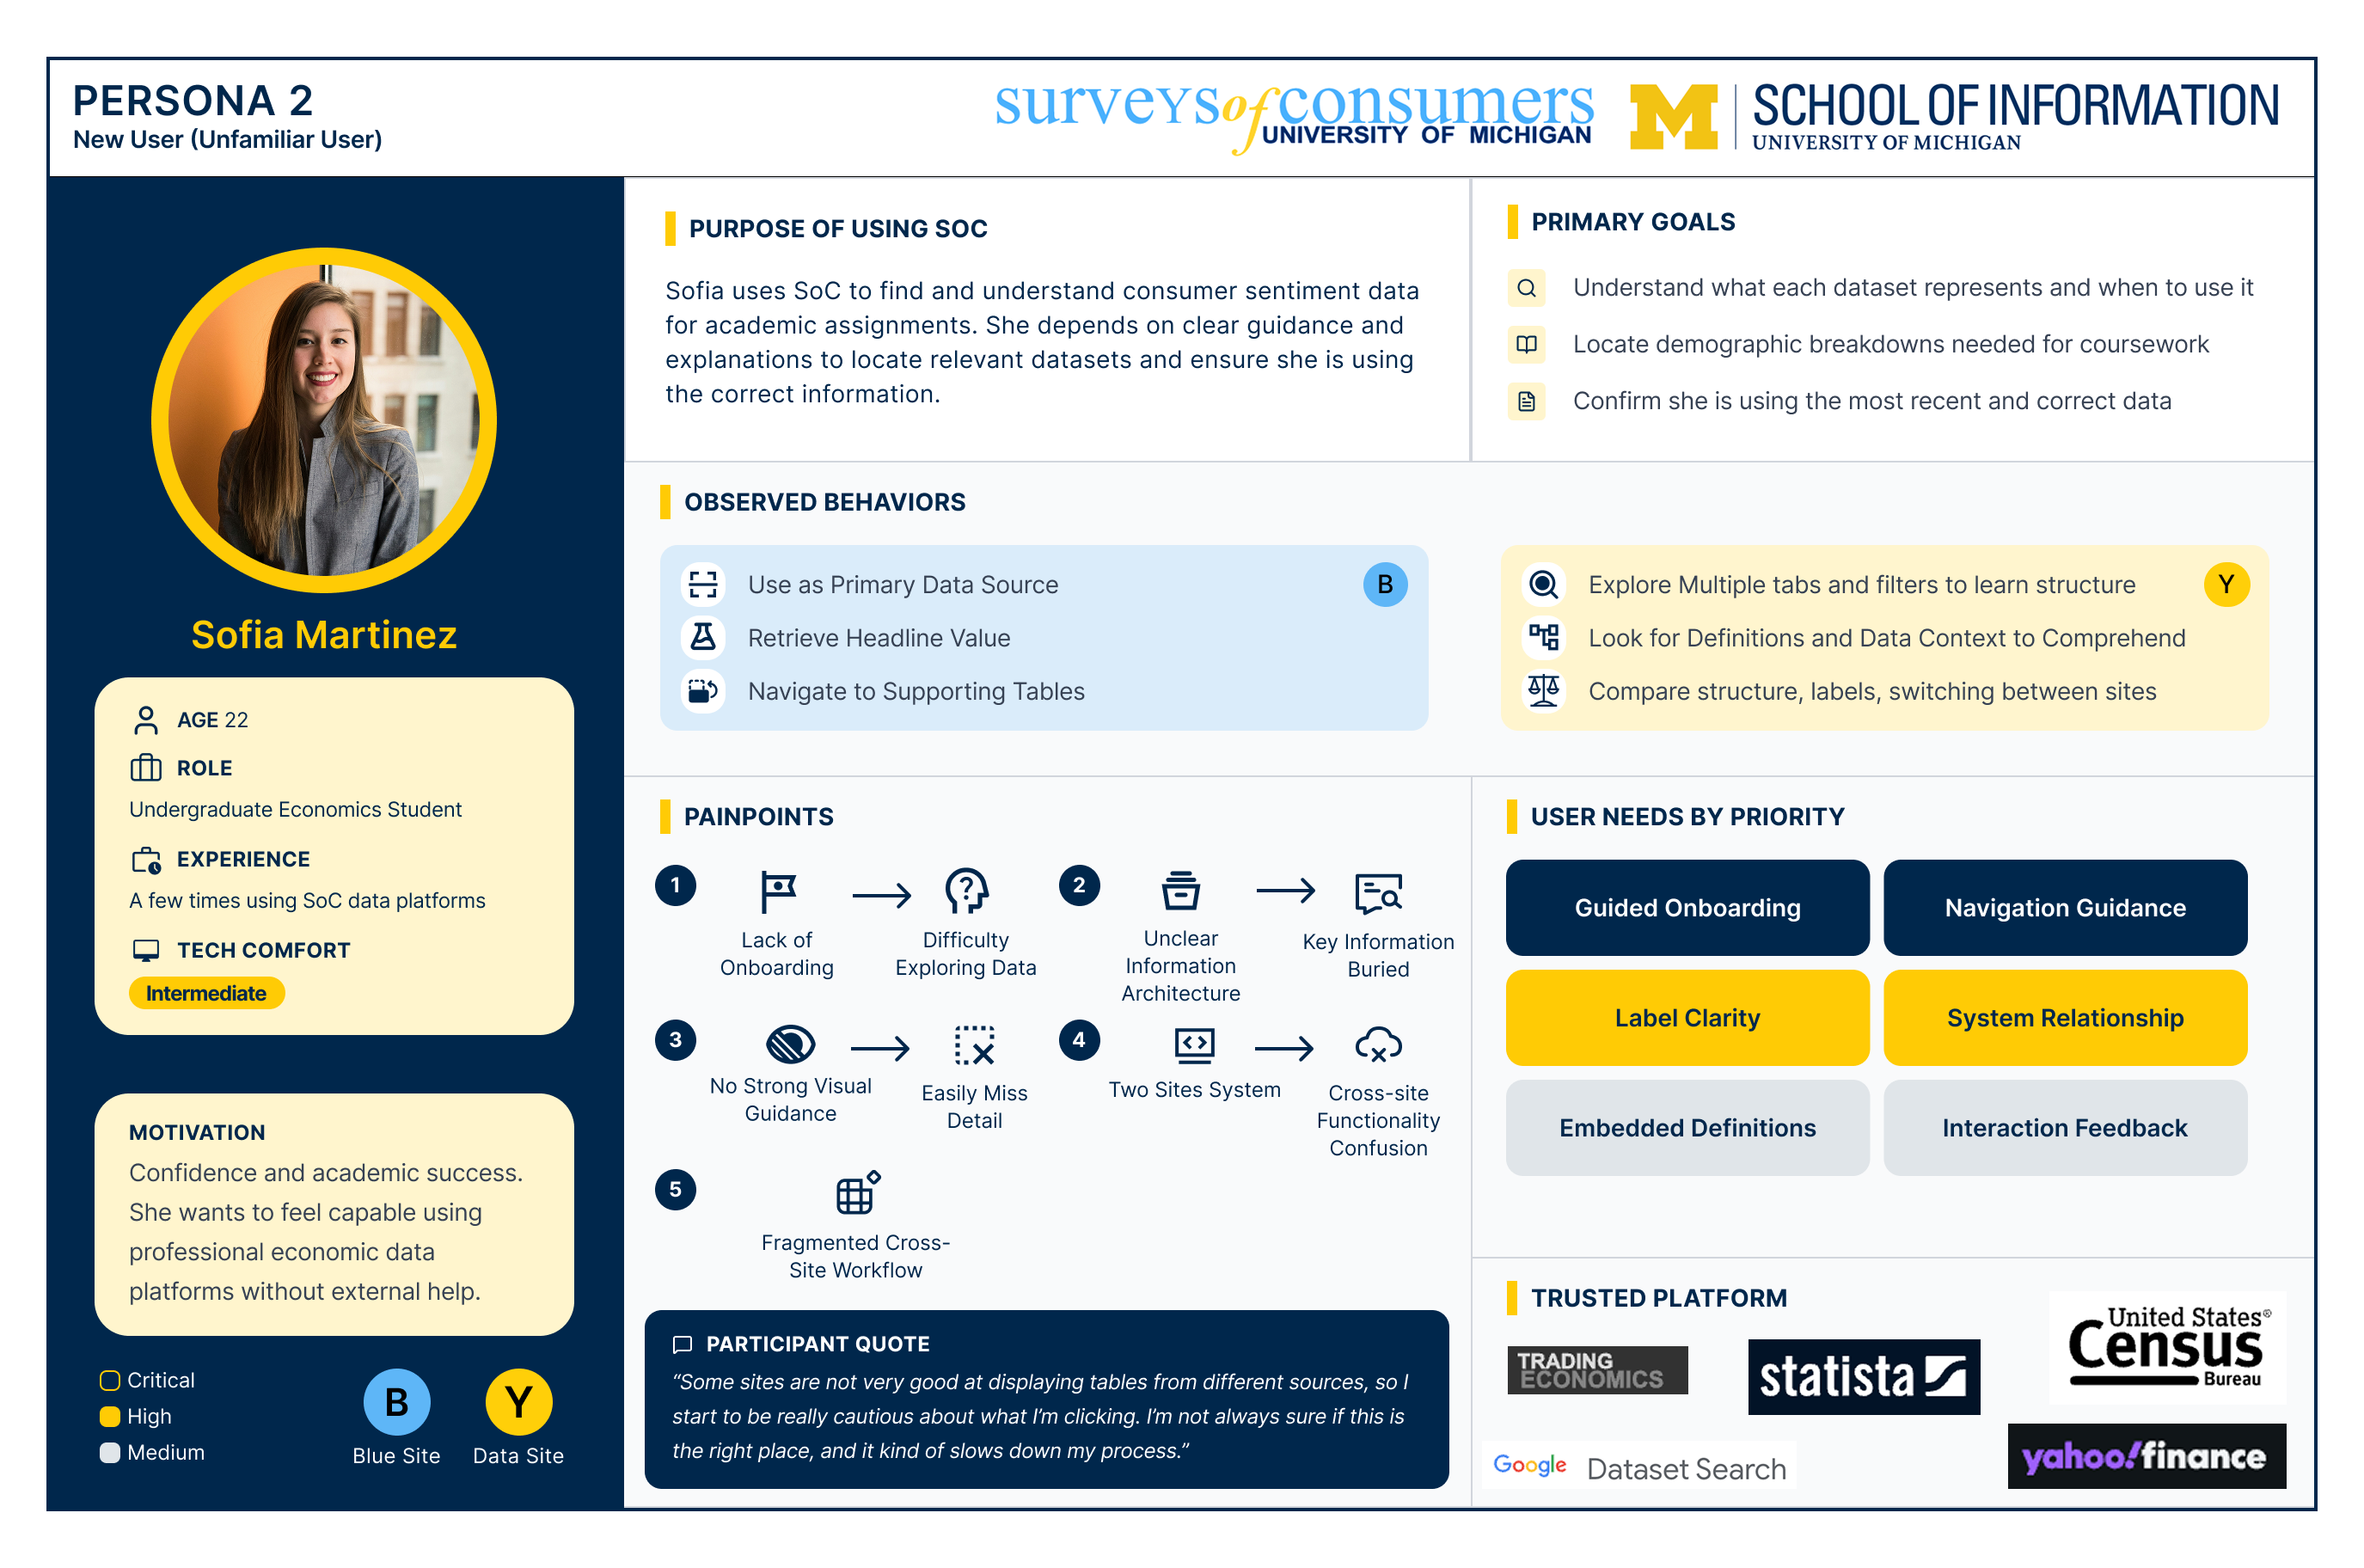
Two personas emerged. Daniel — returning professional, visits weekly, needs to verify a number and leave. Sofia — first-time undergrad, has never heard of the ICS. They helped us reason about two ends of the user spectrum: experienced returning users and unfamiliar first-time visitors.
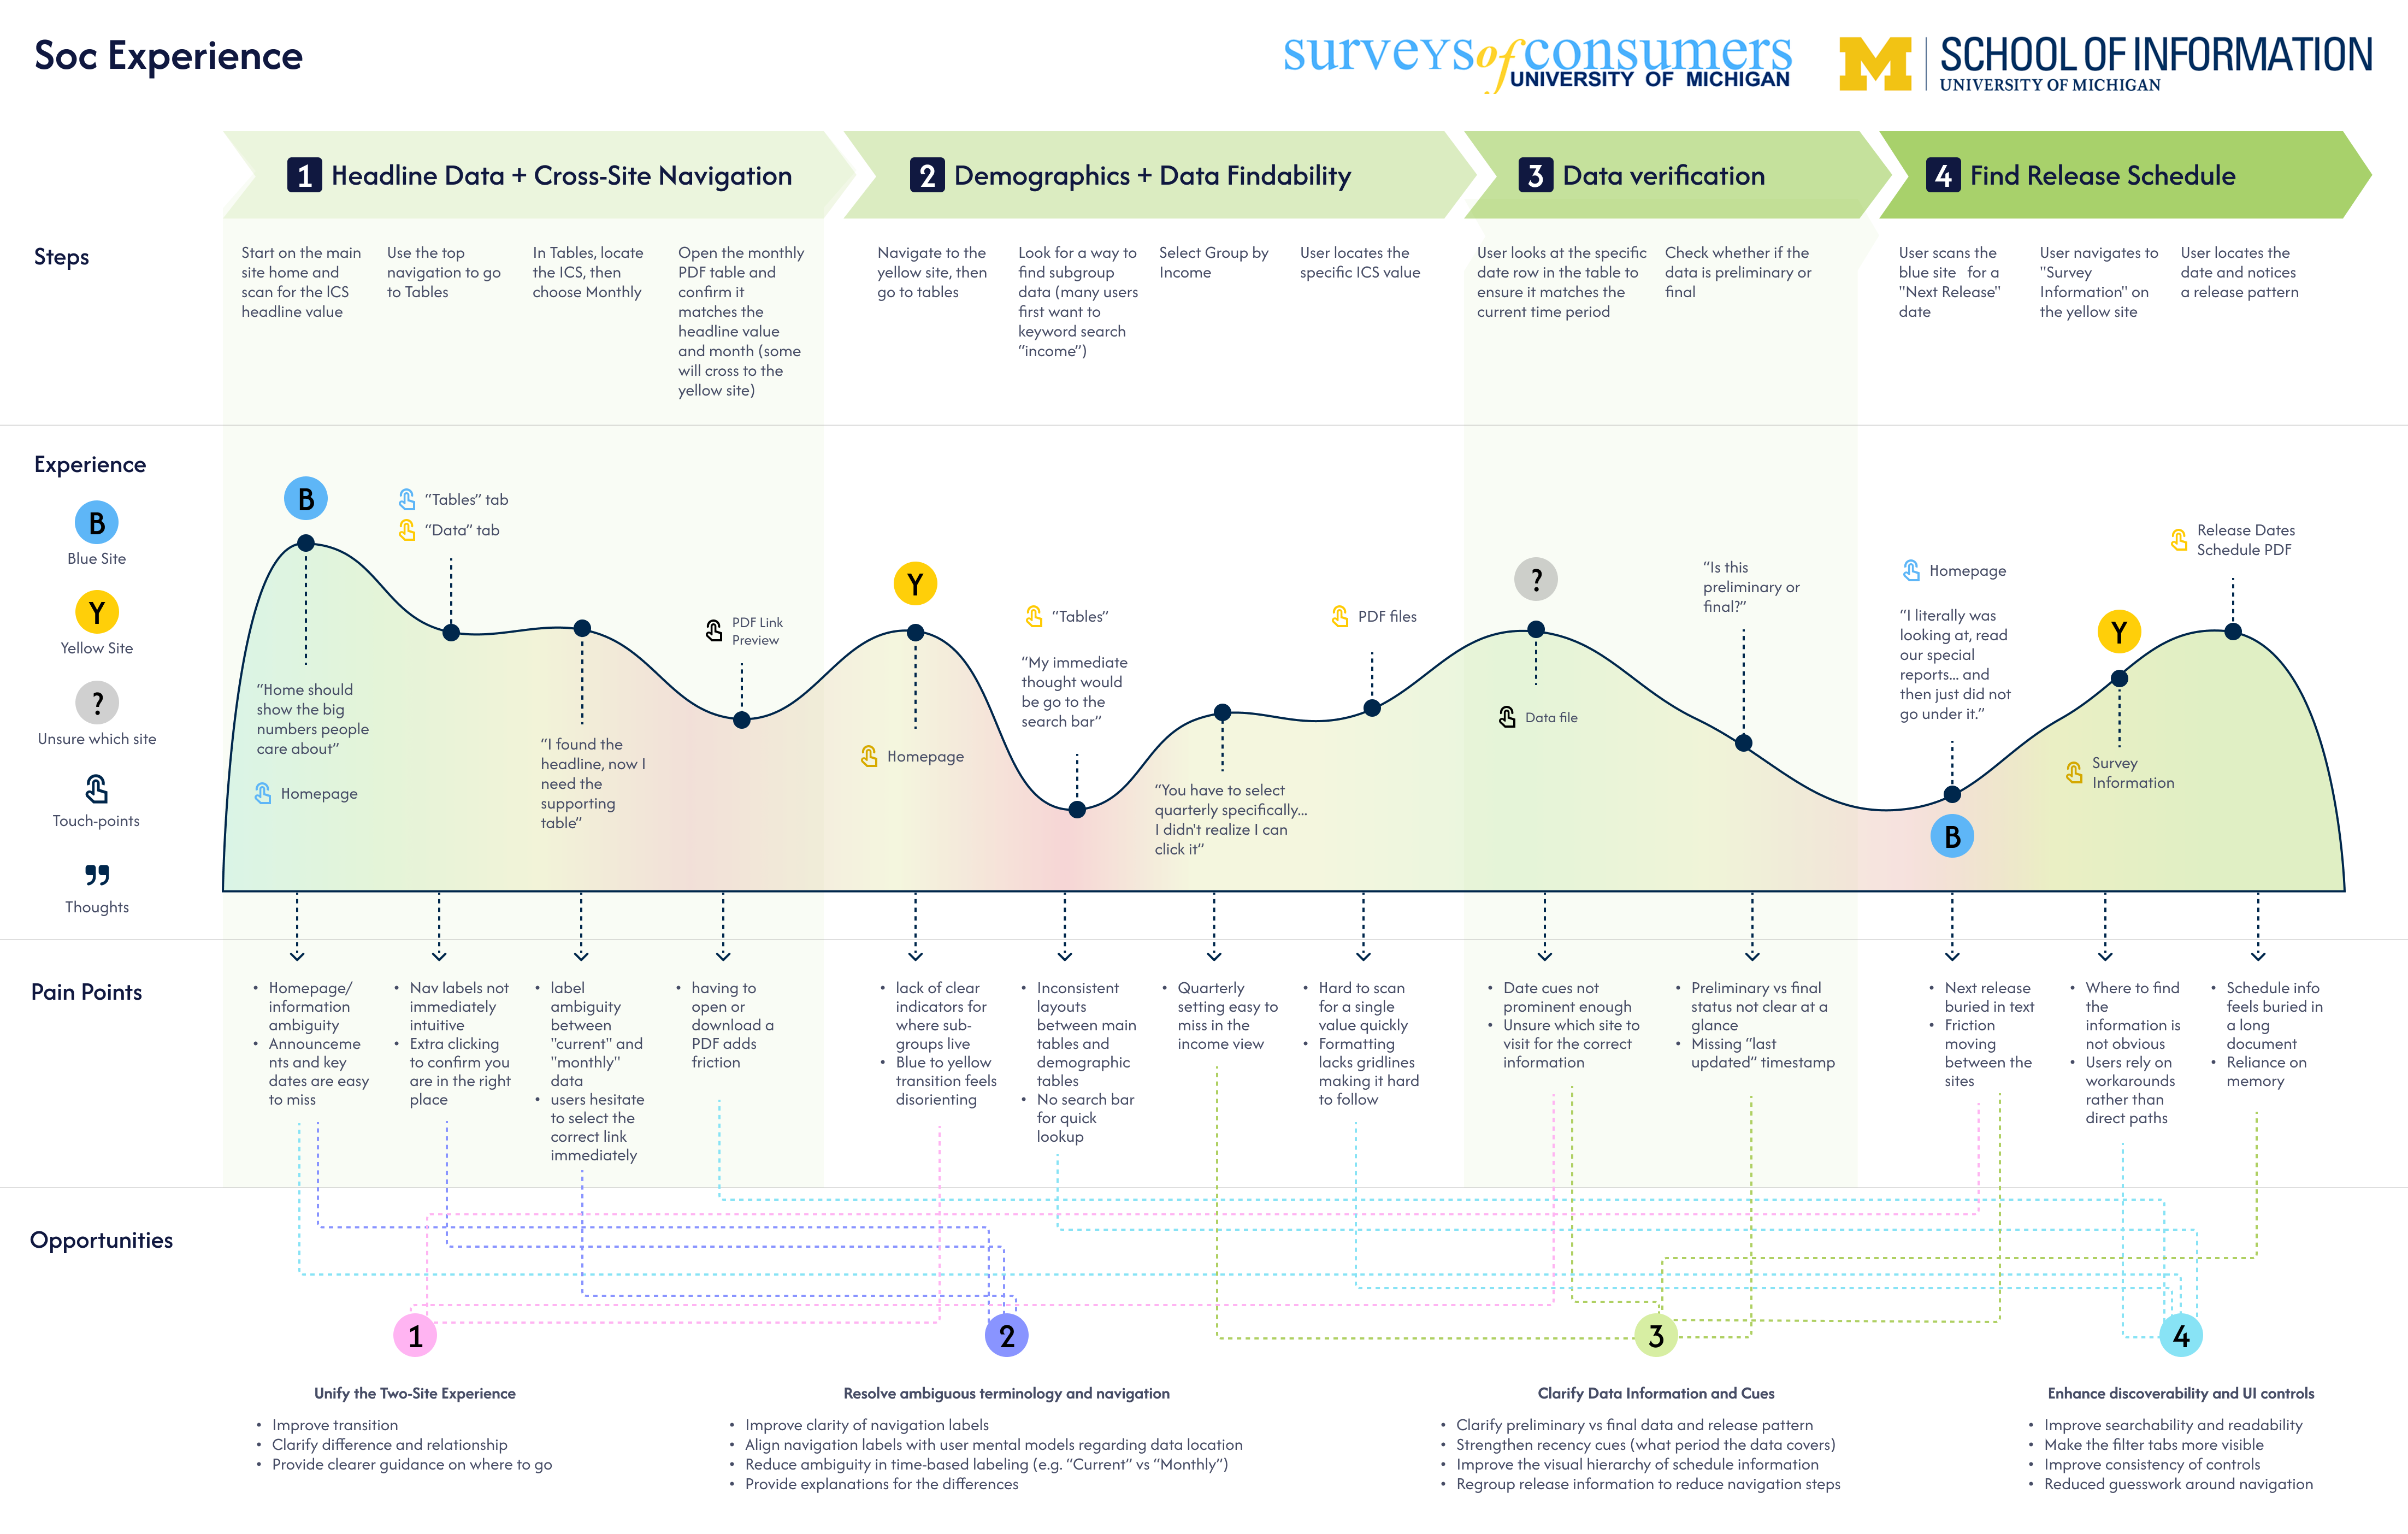
The journey map: where the dual-site friction actually hits
Mapping both personas side-by-side made one pattern impossible to ignore: nearly every pain point clustered at the moment users had to jump between the Main site and the Data site. That cross-site handoff — not the visuals, not the labels — was the load-bearing problem.
04 // Analysis
The t-test that killed the tutorial hypothesis
We ran a t-test comparing first-time and returning users on three core usability measures. They scored almost identically on all three — and a follow-up correlation showed the three measures were tightly linked, meaning they were really tracking one thing: whether the IA worked.
Quick refresher: a t-test checks whether the difference between two groups' averages is real or just noise. The p-value is the chance that difference is random — below .05 usually means "real difference," above .05 means "can't tell them apart." All three p-values here are well above .05, so first-time and returning users are statistically the same.
| Measure | First-Time Users | Returning Users | p-value |
|---|---|---|---|
| Ease of finding | 3.43 | 3.56 | p = .550 |
| Label clarity | 4.06 | 3.90 | p = .576 |
| Presentation clarity | 3.83 | 4.28 | p = .072 |
If the problem were unfamiliarity, returning users should have pulled ahead — they didn't. The friction was structural, not a learning curve. I killed onboarding and redirected that budget into IA. The correlation that followed (label + presentation clarity explained ~38% of findability variance) then became my filter: if a change didn't move labeling or visual hierarchy, it waited.
05 // Design Decisions
Four changes, each filtered through the correlation data
Before anything else — the IA rebuild
The first thing I owned was the sitemap. The original architecture was split across two URLs with overlapping categories and buried headline content. The proposed sitemap collapses that into a single unified structure, organized around how users actually ask for data — by topic, time period, and release type.
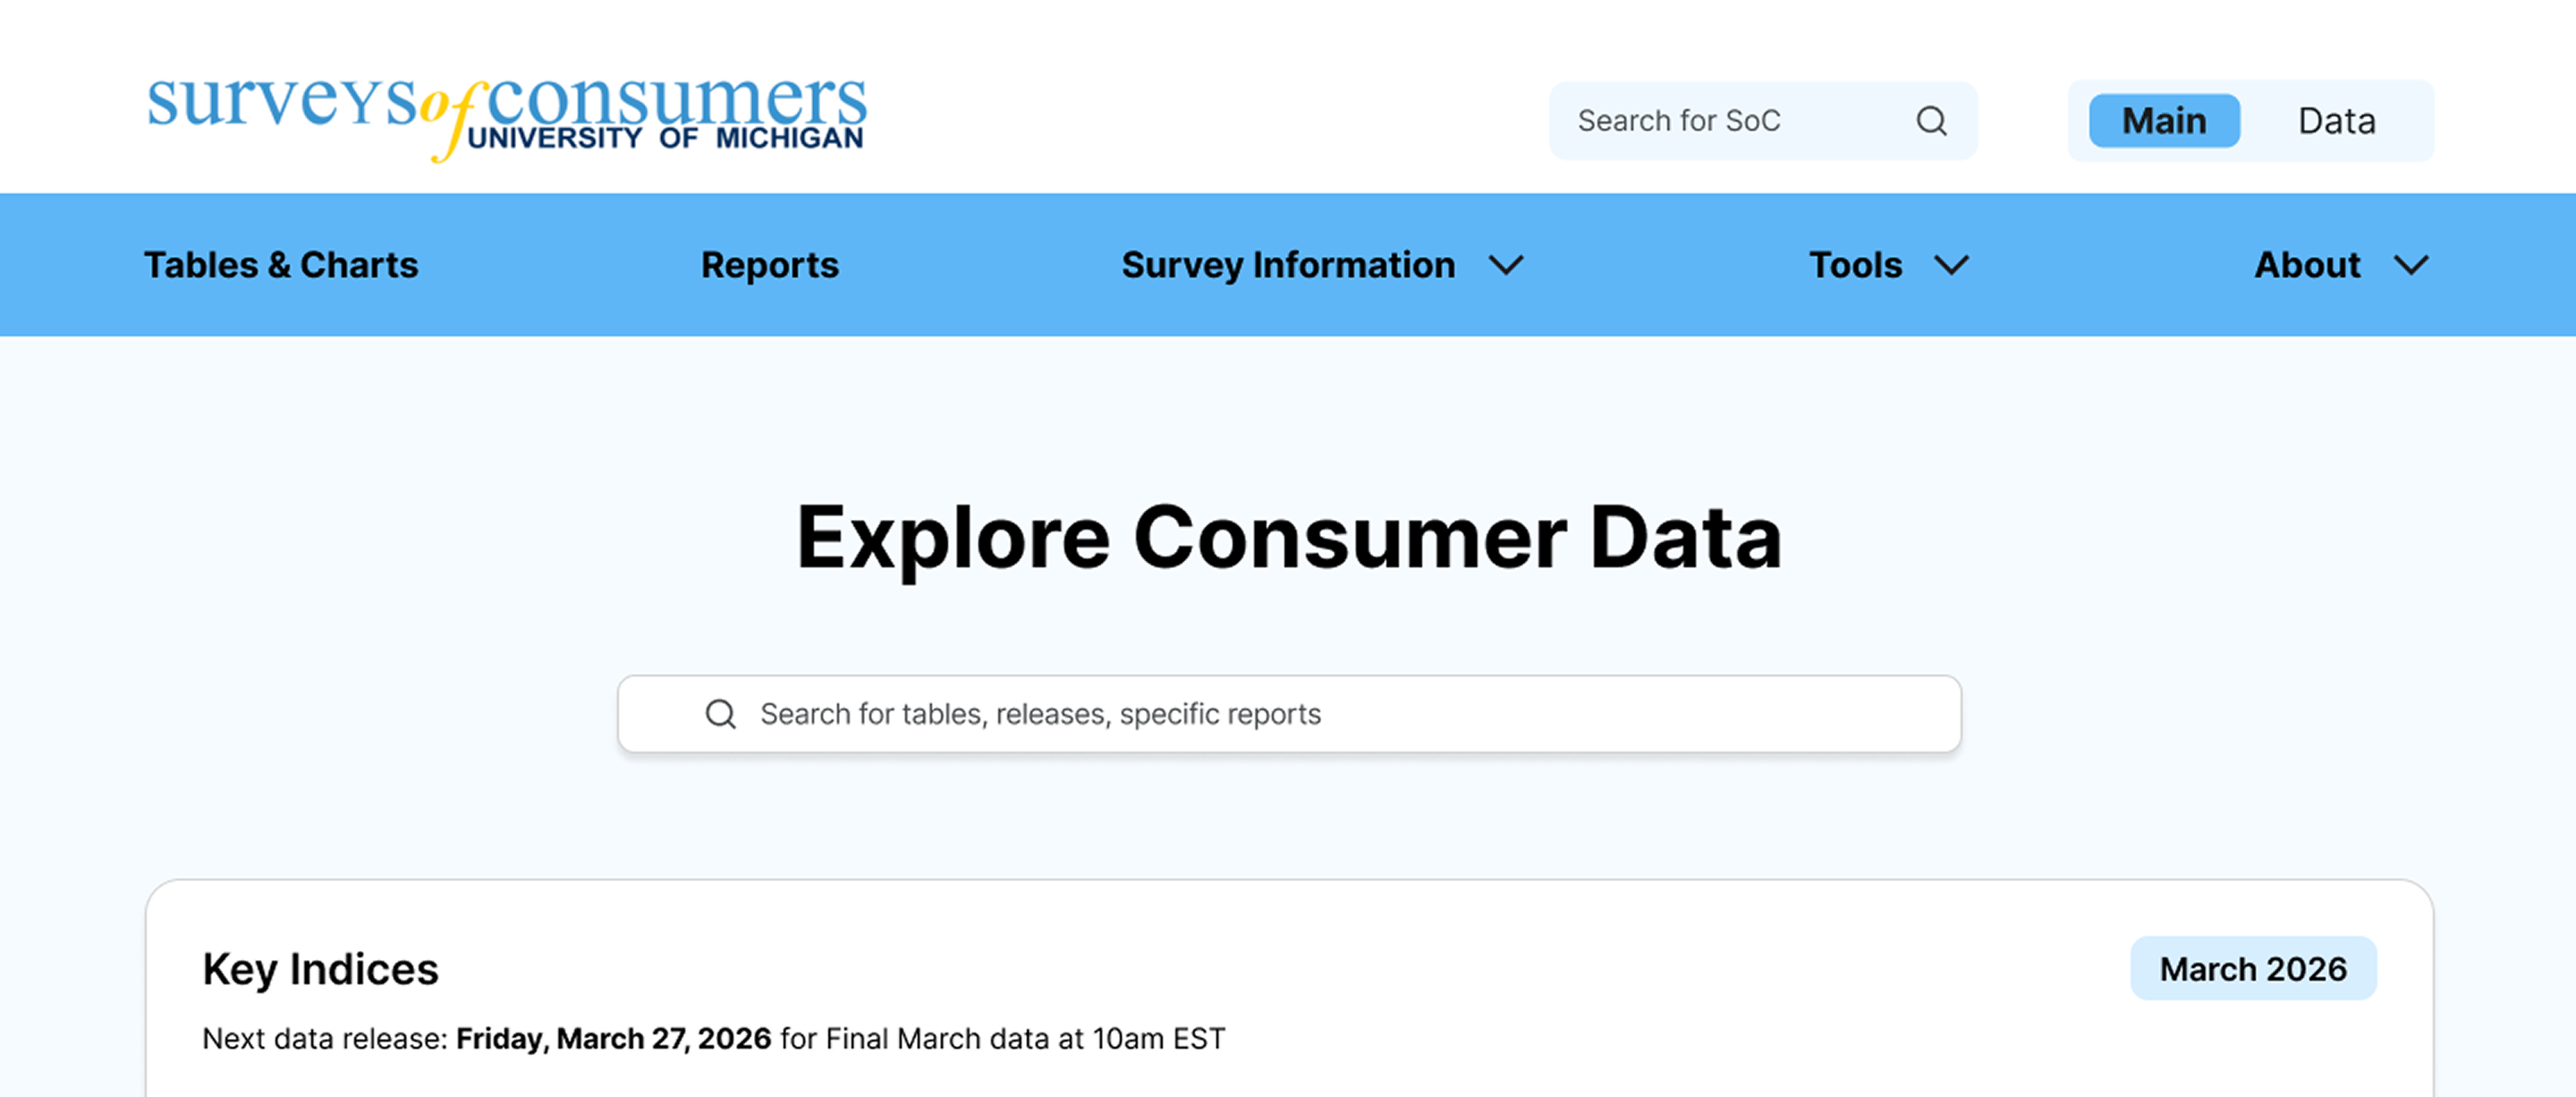
1. Unified Single-Site Experience
Two sites collapsed into one, with a Main/Data toggle in a persistent header. A group (original site): 43% questioned the split and multiple users hit cross-site nav loops. B group (redesign): cross-site confusion dropped to near zero.
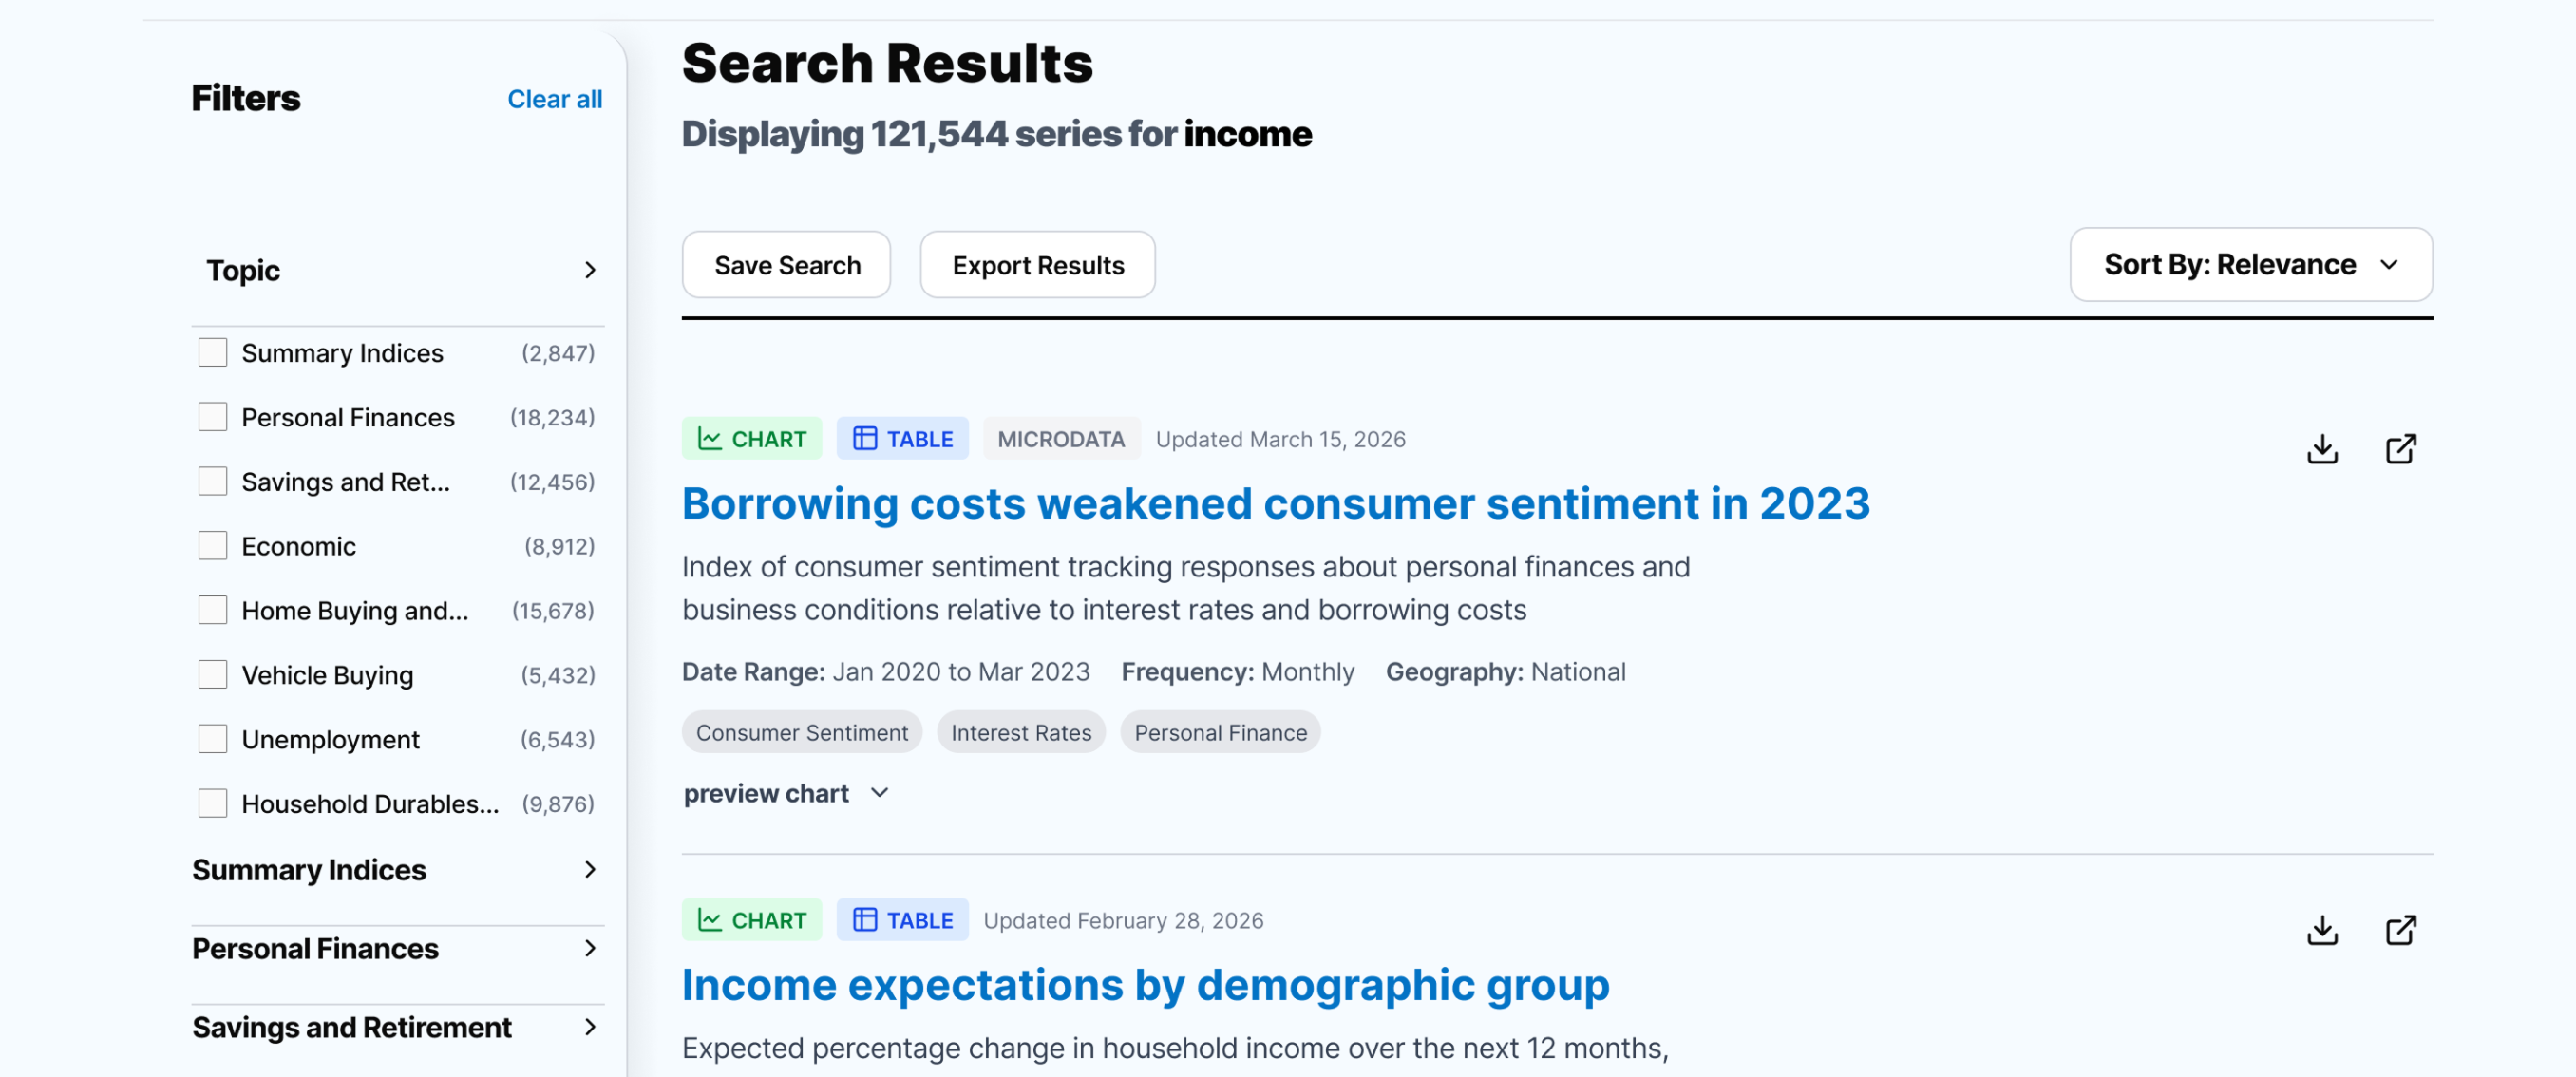
2. Search-First Architecture
Added a search bar with TABLE/CHART/REPORT badges and suggested searches. A-group users (original site) repeatedly asked for search unprompted. B-group users (redesign) called it "the biggest improvement."
"The biggest improvement. I hate navigation, but I like the search bar."
— Participant (B group)
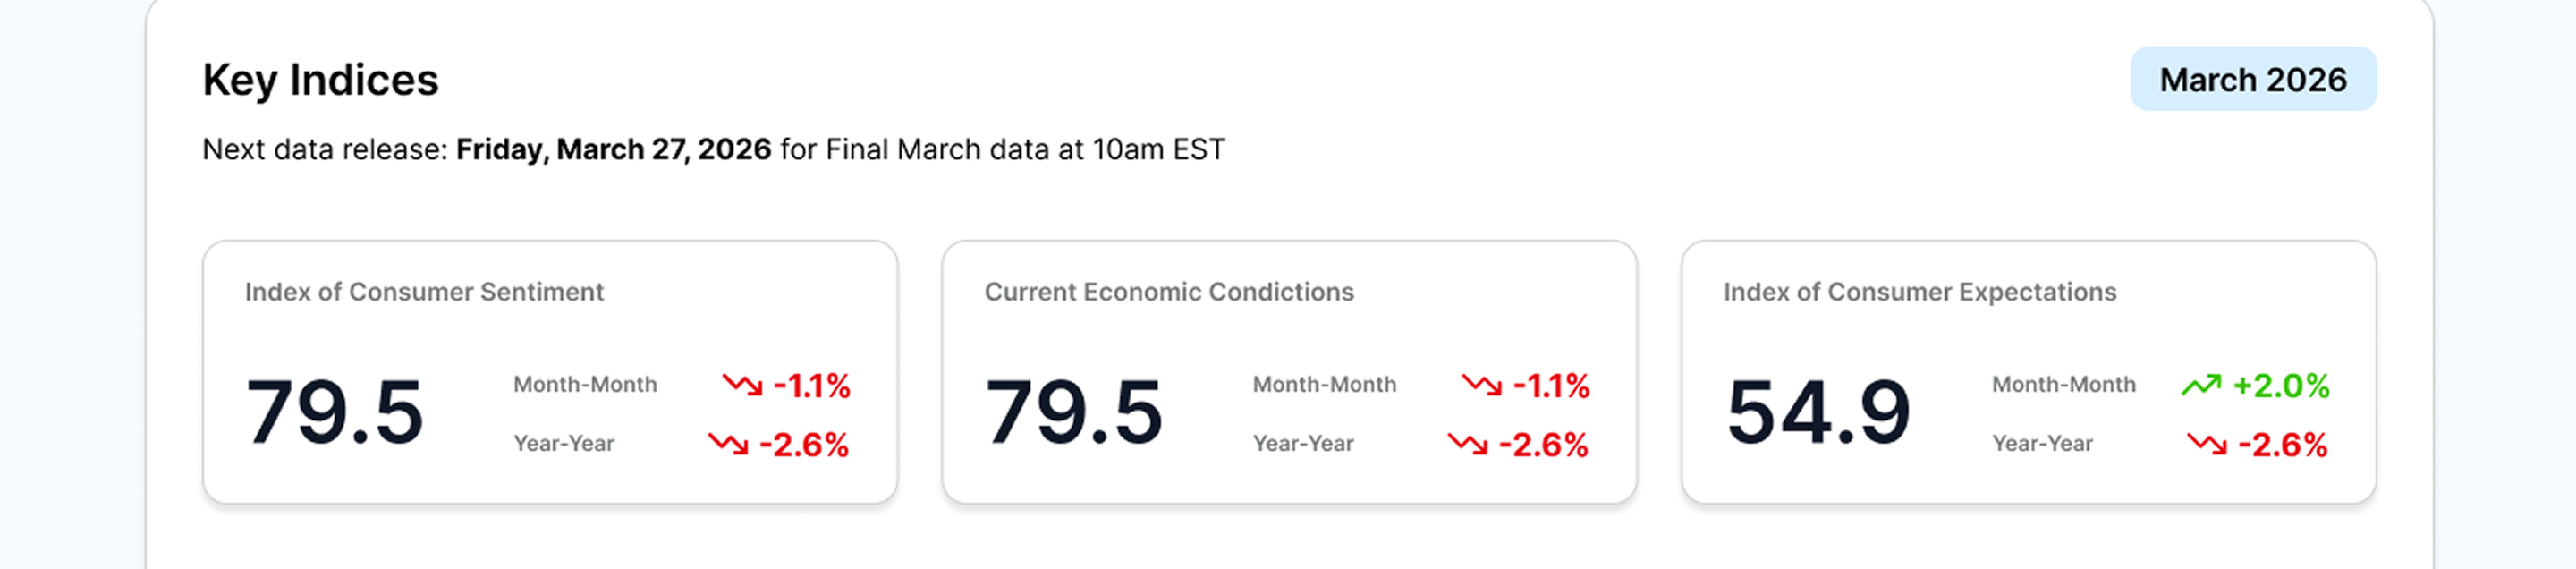
3. Scannable Homepage with ICS Cards
Dense paragraphs replaced with metric cards: ICS value, MoM, YoY, trend arrows. B-group users (redesign) located the headline in seconds, while A-group users (original site) had to click through extensive navigation.
4. Faceted Filter System
Trial-and-error nav replaced with filters by Topic, Geography, and Time Period. Every filter label was tested for immediate comprehension — a direct application of the r = .615 correlation finding.
06 // Impact
Average task performance score improved from 61.2% to 75.7%, while cross-site confusion dropped to zero.
Using the same 3 core tasks and a shared scoring rubric, we compared A-group users on the original site with B-group users on the redesign prototype. The redesign improved overall task performance and reduced navigation friction.
How we evaluated the redesign
To validate the redesign, we ran an A/B-style comparative usability test with two groups of target users. Both groups completed the same 3 core tasks. Rather than using a simple yes/no completion count, we scored each task on three dimensions — completion (50%), independence (30%), and path efficiency (20%) — then averaged task scores at the participant level and compared group averages across the original-site and redesign conditions.
| Metric | A Group (Original Site) | B Group (Redesign Prototype) |
|---|---|---|
| Average task performance score | 61.2% | 75.7% |
| Completion quality | Frequent hesitation and misrouting | More direct, self-sufficient task paths |
| Independent completion | Lower — often required prompting | Higher — tasks completed without help |
| Path efficiency | Lower — backtracking and dead ends | Higher — shorter, more direct routes |
| Cross-site confusion | Present — dual-site loops observed | Near zero |
Behavioral observations
Selected observations from usability sessions included frequent cross-site confusion, repeated requests for search, and difficulty locating the ICS headline value on the original site. These observations informed the redesign, but the primary validation metric reported here is the average task performance score.
"Visually much more appealing and more intuitive to navigate."
— Participant (B group)
"Bolded numbers help understanding. Faster."
— Participant (B group)
What we're watching after launch
Usability-test wins are evidence, not proof. Once the redesign is live, three metrics tell us whether it holds up in real traffic:
- Task completion on find-data flows — % of sessions that reach an ICS value, demographic breakdown, or historical report.
- Search usage rate — % of sessions using the search bar. Validates the search-first bet.
- Cross-site nav loops — should stay near zero, confirming the unified structure resolved the dual-site confusion.
Known follow-ups
- Reduce visual density — swap card borders for whitespace and type hierarchy ("box fatigue" flagged by B-group users).
- Make ICS cards interactive — users tried clicking them expecting detail views.
- Clarify "Papers" vs "Reports" — confusion observed in A-group (original site) sessions.